In conjunction with integrating SolarWinds
Log and Event Manager (LEM) with my LOGbinder
software I had an opportunity to get to know LEM and I thought I’d share some
of the highlights of what I discovered. Click here to download LEM now!
For me, the most important thing about a log management / SIEM tool
is its analysis functionality. How much
built-in intelligence does it have about common event logs and how powerful are
its capabilities for alerting you to important activity, reporting for
compliance and adhoc research? LEM
employs my favorite SIEM feature for increasing maximizing analytical power –
normalization.
Architected for
Normalization
With normalization, your SIEM vendor compiles schema of log
source agnostic event types that are common to nearly any technology. These event types include things like:
-
File operations
-
User account maintenance
-
Group membership changes
-
Configuration changes
-
Network traffic events
SolarWinds provides connectors for common log sources that
understand how to translate raw events from a specific log source into their
equivalent normalized event type. For
instance the screen print below shows a search based on Alert Type New Group
Member (in LEM, alerts are any events of interest – that is not
discarded).
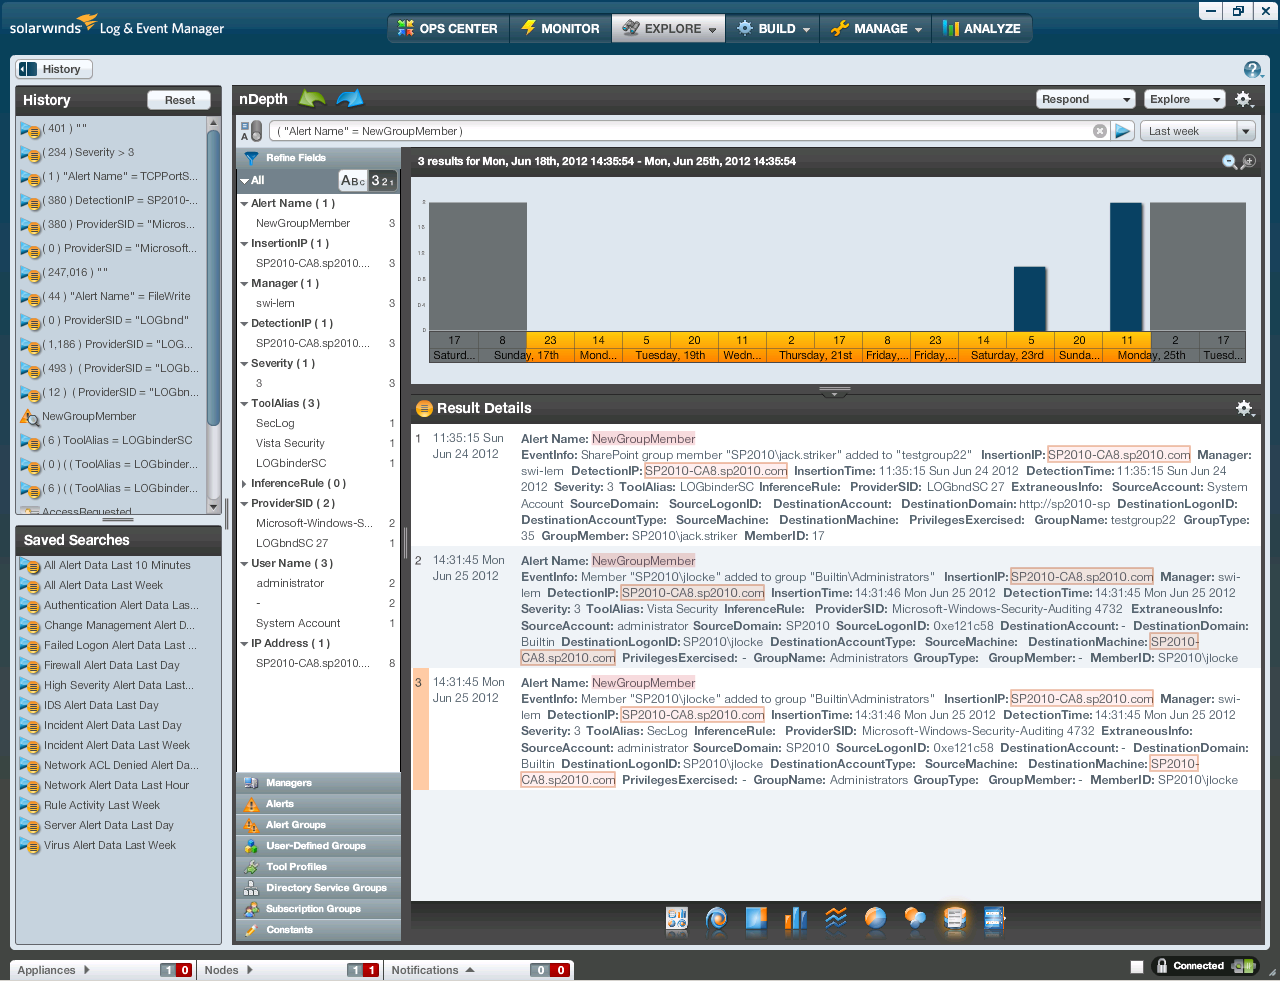
When you query for this Alert Type you will get any group
membership additions from all monitored log sources. In the example above you see a member added
to a Windows local group as well as a new member added to a group in
SharePoint. That screen print really
illustrates the power of normalization.
You no longer need to be an expert in every arcane log format produced
within your organization. (It’s hard
enough to learn the Windows event log – much less all the other security logs
found on a typical network.)
As raw events come into LEM, the appropriate connector
compares the event to its alert criteria and discards unmatched events. The remaining events are normalized into
alerts. This processing takes place in
the local agent which increases efficiency since unimportant events are
discarded at their source. The
normalized alerts are then fed to the central LEM manager over an encrypted
connection which ensures security and audit integrity.
At the manager, alerts are processed according to the alert
distribution policy. Each alert may be
dispatched to one or more of the following:
1.
Alert Correlation Engine
2.
Console for display in dashboard Widgets or in
filter views
3.
Storage for future reports and analysis
Automated Response
through Rules
The Event
Correlation Engine is where Rules are processed. Rules define automated responses to
correlated alerts. LEM makes it easy to
define rules. You essentially build a
graphical flow chart of the rule by dragging and dropping conditions, actions
and Boolean logic operators on to the rule canvas; no cryptic data entry here!
The automated responses you can select range from sending emails
to your security analyst, to killing offending processes, updating a user
defined list or creating an incident.
The latter 2 are particularly interesting.
Incidents are a special kind of what I would call meta-alert
in LEM. You can define rules to trigger
Incidents from any alert that should be followed up on and for which you need
to document such follow up. While LEM
documentation suggests printing out a daily incident report and noting your
follow up and signoff on the hardcopy, I think it would be more efficient to
have the report emailed to a SharePoint document library. In the document library you could add
additional columns or workflows for documenting follow up and signoff.
User defined lists (called custom groups in LEM) allow you to
compare alerts against any list of items you define. For instance, you could create a list of
privileged users and then define multiple rules that use that same list to
identify activity where the actor or target is a privileged account. Of course the disadvantage of such lists
would be the burden of keeping them up to date.
That’s where the user defined list actions come in so handy. You can automate the maintenance of user
defined lists!
For instance you could create a rule for new group member
alerts where the group is Administrators, Domain Admins or Enterprise
Admins. Then set a response action that
adds the new member’s name to a Privileged Accounts list and a rule to handle
the opposite case where a user is removed.
Of course to handle nested groups you’d need to handle some additional
logic but a couple additional rules for maintaining an Admin-Equivalent Groups
list would do the job.
Interactive Analysis
The LEM console provides three levels of interactive
analysis. Starting on the Ops Center tab
(see below) you have a pane of customizable dashboards called widgets.
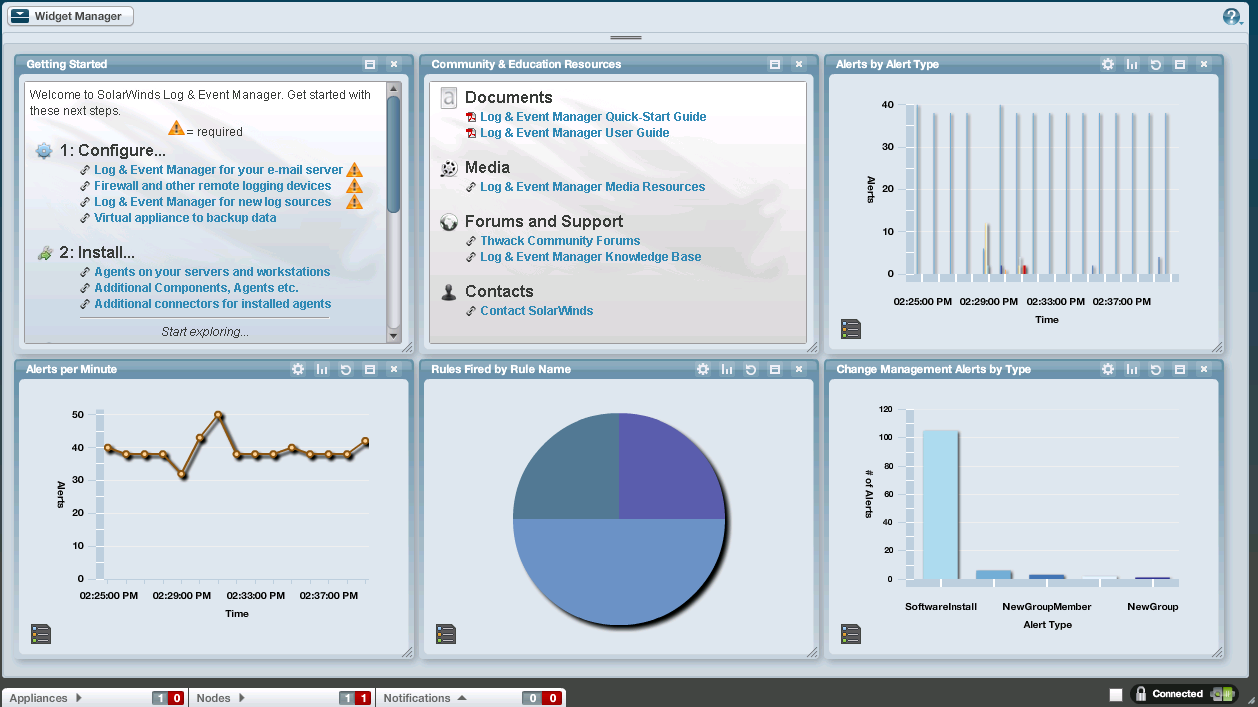
A Widget is a visualization (e.g. simple table or a pie/bar/line
chart) combined with a filter that controls which alerts are represented in the
Widget. This makes it easy to define key
security indicators and keep an at-a-glance eye on them. You can drill down into a Widget which takes
you to the next level of analysis – the Monitor tab (see below).
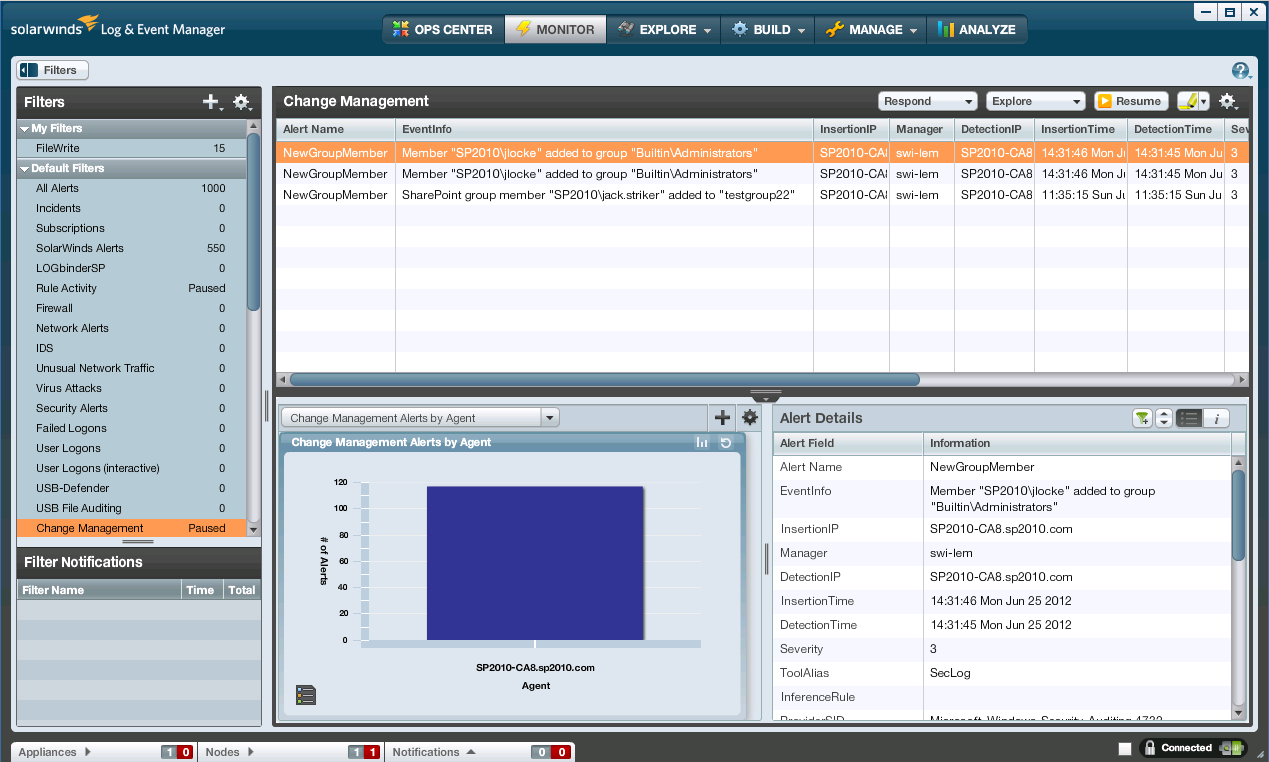
The monitor tab allows you to select a filter which displays
on the right, the alerts matching that filter.
Then when you select an alert, its details are displayed on the bottom
pane. When you enter the Monitor tab via
a Widget drilldown back on the Ops Center tab, LEM automatically selects the
same filter as the Widget you just came from making it easy to see the activity
behind the Widget.
You can select any data value in the Alert’s details and
select Explore which takes you to the 3rd level of analysis – the
nDepth display on the Explore tab (see very first screen print).
nDepth is a really cool way to do adhoc analysis of security
log activity. At its root, nDepth is a
search application that allows you to enter search terms in a single, Google-like
search field. And then of course the
matching alerts are displayed in a list underneath. However the capabilities go far beyond that
simple description.
In addition to displaying matching events as a simple list,
you can choose to visualize the data in a variety of chart formats, word
clouds, tree maps and more. Whenever you
change your search criteria, LEM adds your old criteria to the History list. Whenever you build a search you like and want
to re-use you can save the search and it appears in the Saved Searches
list. This makes it easy and superfast to
go back to recent searches or searches you knew you’d want to use again.
nDepth provides a number of ways to make it easier to refine
your search. In the Refine Fields pane
you see a list of all the field names found in the current result set. Under each field name you find a list of all
the values occurring for that field along with their count. You can drag any of these field names or
values to the search terms field and nDepth will automatically add a Boolean
expression that further filters the results.
You can highlight DNS names and IP addresses and run lookups
like Whois, traceroute, NSlookup. Or you
can on demand have any of the actions available to Rules described above to be
executed on the manager or agent system.
Wrapping Up
Beyond these three highly interactive and progressively
deeper analysis tools, you can also schedule reports to be automatically
produced and delivered via email. LEM
runs as a physical or virtual Linux appliance, the latter being easy to download
and quickly set up to run in your hypervisor.
Being a Linux appliance makes it easy to setup the appliance as a
separate isolated log management with access controls to prevent tampering by
admins of the systems you are monitoring which is an important architectural
consideration if you are depending on your SIEM to provide accountability over
admins. And though it’s a Linux system,
you don’t really need to be a Linux guru because the appliance can be almost
completely managed via the desktop console which runs on your workstation.
SolarWinds hosts an active user community called Thwack
where you can exchange filter, report and rule content, request new features, keep
up with new developments and get help from SolarWinds and community members.
SolarWinds Log and Event Manager is a capable SIEM software
solution that incorporates my favorite SIEM feature – normalization. The interface is highly visual with very few
instances where you must enter cryptic text and codes.
You can download a trial of LEM from
http://www.ultimatewindowssecurity.com/redir.aspx?name=sw_reg